![[MY HOME PAGE]](../gif/home.gif)
![[TOP]](../gif/top.gif)
![[UP]](../gif/up.gif)
Draft text for article published in:
Embedded Systems Programming,
6(5), May 1993, pp. 26-34
(For a nicely typeset and edited version, please refer to that published article.)
While the cache memory designed into advanced processors can significantly speed up the average performance of many programs, it also causes performance varations that surprise system designers and cause problems during product integration and deployment. This paper gives a description of cache memory behavior for real-time embedded systems, using the example of real data collected from an 80486 CPU interrupt service routine. While vendor-supported tools for predicting and bounding worst-case CPU delays are still in their infancy, there are some coping strategies that will reduce problems while minimizing risk.
Thinking of using a hot new CPU for a real-time control application? Do you embed PC chip sets in your product, but need a speed boost? Well, before you design-in the latest and greatest high end CPU, I'd like you to consider whether your application can tolerate the unpredictabilities introduced by features such as caches found in the latest and greatest processors.
I'm going to show you how, in certain circumstances, the very design features that can make CPUs blazingly fast also cause surprises. And in embedded systems, surprises are seldom good. In particular, I'll be talking about problems introduced by the cache memory found in the Intel 80486. Fortunately, once you know some of the major sources of problems, you can account for them and avoid most surprises while reaping the benefits of embedding a high-end PC chipset. While I'll only cover the 80x86 family, most of the principles apply to other CPUs, both RISC and CISC.
The two surprises I'm going to discuss are lack of predictability and lack of determinacy. Other surprises, such as late deliveries, hardware bugs, and incorrect data sheets, are left as an exercise for a different author.
For our purposes, predictability means that when you write a piece of code, it not only does what you expect, but takes the amount of time you expect it to take. Determinacy means that the results of executing a piece of code, including how long it takes to execute, don't change from run to run. Prior to the 80486, the 80x86 CPU family could probably be categorized as having moderate to good predictability and good determinacy (in systems without off-chip cache).
Now I should point out that in theory just about every bug-free software/hardware combination is completely predictable and has perfect determinacy. However, if predicting code execution speed requires detailed knowledge of every transistor and every bit of microcode inside the CPU, as a practical matter it isn't predictable to the average programmer. Similarly, if high determinacy only exists for a precise sequence and timing of external events, then that isn't very useful for real-world applications that have to deal with changing environments. So, for our purposes we shall use predictability and determinacy to apply to situations involving off-the-shelf development tools and real applications.
The primary source of unpredictability in earlier 80x86 CPU's was probably that timings in the reference guides assumed the instruction bytes were available in the prefetch queue. The clever programmer could spot sequences of fast instructions that were likely to outstrip the prefetch queue refill rate, which was a fairly common situation on the 8-bit 8088 memory interface. Compensating for stalls caused by waiting for instructions to be fetched from memory could often lead to accurate, if tedious, timing estimates. For those who didn't have the inclination to count clocks and bytes, the easy way out was to add in the 5% fudge factor supplied by chip vendors to timings. Usually the fudge factor worked well, and life was relatively blissful. Now I know I am setting myself up for dozens of letters from programmers who have a pet horror story about how their particular code snippet was 50% or 100% slower than the data book timings (I have my own too), but in general developers didn't lose jobs and people didn't die because of this problem. The important point was that with minor attention to key code sequences it wasn't too hard to predict the performance of a piece of code.
Similarly, with early 80x86 family members determinacy was not too much of a problem. True, an inopportune memory refresh cycle could cause the prefetch queue to empty unexpectedly and cause a few clocks of stalling, but again the effects were relatively minor (again, there are probably horror stories, but they are minimal compared to what I'll show you later). Of course the effects of masking interrupts for long periods of time could be major, but that sort of problem is of the programmer's making, not the hardware's. The important point was that after a few dozen program runs, it was very likely that indeterminacy problems caused by the hardware itself would be caught.
However, with the advent of cache memories on some 80386 boards and all 80486 chips, determinacy and predictability have taken a decided turn for the worse. The problem with poor predictability is that performance of programs can be very difficult to characterize during development, increasing schedule risk and creating uncertainty about required CPU speeds and hardware budgets. The problem with poor determinacy is that a fielded product could well have latent timing problems that are extremely difficult to detect, reproduce, and correct. As embedded controllers are used in more and more situations that affect personal safety, attention to such latent defects becomes ever more important.
In order to show the magnitude of the surprises you might find with a high-end 80x86 processor, let's use an example. Let's say you want to read data in and put it in a circular queue with a really simple interrupt service routine (ISR) written in Turbo C:
#define DATA_AREA_MASK 0x7f
char
data_area[DATA_AREA_MASK+1];
int queue_ptr;
void interrupt get_a_byte( )
{ data_area[queue_ptr] =
inportb(IN_PORT);
queue_ptr = (queue_ptr+1) & DATA_AREA_MASK;
}
The details of the rest of the program are not terribly important, but let's say you have code that is guaranteed to consume data from the queue before the pointer wraps around and overwrites old data.
Now, it would be really nice to know exactly how long this routine will take to execute. For one thing, it is important to have an idea of how much time is taken by the ISR on average so that you can decide how much of the CPU capacity it will consume. But, for many applications it may be even more important to determine the maximum guaranteed repetition rate, so that input bytes won't be lost from the data acquisition hardware due to slow interrupt response.
The obvious solution, especially for those of us who cut our teeth on wimpy 8-bit CPUs, is to turn to Appendix E of your 80486 Programmer's Reference Manual, entitled _Instruction Format and Timing_. And, you'll find out that calculating exact timing is beyond most mortals. My revision of the data book gives one or more clock cycle counts for each instruction based on 12 assumptions, and then refers the reader to a set of 33 notes.
While no doubt there are some extraordinarily macho programmers who can in fact correctly compute the expected execution times (and get them right more often than not), this is clearly not a preferred activity for those of us with deadlines to meet. (Now please, don't get me wrong. I am very grateful that Intel supplies the data in such detail! It would be much worse to leave the data out and not even have a chance. It's just that the 80486 is so complex that the data is just too much for most people to handle.) What I'd really like is a software tool to do this computation for me, but alas I know of none (and neither does Intel when last I asked).
Taking the perilous course of just adding up the best-case timing numbers and ignoring all else, I came up with an approximate execution time of 104 clock cycles, including the external interrupt processing. I also found some apparent inconsistencies in timing information between different sections of the book. Let us just say that my experience did not inspire confidence in the add-up-the-numbers approach.
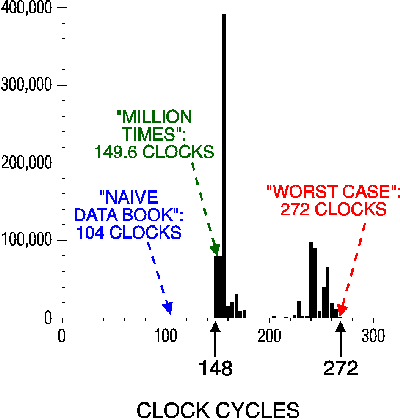
So, if adding up the data book numbers is too difficult, we fall back on the time-honored technique of "run it a million times and divide by a million." To do this I put a software interrupt in a loop to invoke the example code, and disabled all other interrupts to prevent interference from the time-of-day tick, etc. While external interrupts are a few clocks slower than software interrupts, my loop overhead should have about averaged things out. Using this technique gives an expected execution time of 149.6 clock cycles, considerably worse than the data book answer. Now, let's say I used that execution time to establish a specification for maximum burst data input rate in a product. If I did I could be in for some real trouble!

Figure 1. Histogram of one million ISR executions.
The reason for the surprise is that the "million times" approach only captures average performance, and does so in a way that is likely to give an extremely optimistic result. Figure 1 is a histogram of a million execution times for the example ISR on the 33 MHz 80486 PC in my office. Instead of running the routine by itself, interrupts were interspersed with runs of a foreground program that accesses a memory array. I got the histogram by using a high-resolution counter/timer (one clock tick per bus cycle). The worst case time is 272 clock cycles, almost twice the expected case time of 149.6 clock cycles, and pushing three times the data book estimate. For most people, measuring this kind of worst case performance after far more hopeful expectations would constitute a fairly nasty surprise.
So what is causing this sluggish performance in some cases? The primary culprit is the 80486's use of cache memory. All 80486 chips have on-chip cache memory, and most implementations use off-chip cache memory as well.
Briefly, cache memory is a small amount of high-speed RAM that is quickly accessible to the CPU. Data that has been recently referenced, or is predicted to be referenced in the near future, is copied from main memory into cache automatically as programs execute. Whenever a byte of memory is accessed, the CPU checks the cache first to see if a copy is available. If the data or instruction is in cache, a cache hit takes place, and the on-chip CPU cache can return the value in a single clock cycle. If the memory value hasn't already been copied to cache, then a cache miss takes place, involving an access to main memory DRAMs. Further details of cache operation are beyond what I'll cover here, but there are many discussions of the topic available.
With cache memory, code and data that are touched frequently, especially small loops, tend to be available in the fast cache memory most of the time. Code and data that are infrequently accessed tend not to be found in cache because they have been displaced by newer values, and require lengthy accesses to main memory DRAM. The advantage of using cache is that frequently used memory locations are usually accessed quickly, which gives high average execution times. The disadvantage of cache is that speedups are of a statistical nature, and there are no guarantees for any particular short period of time.

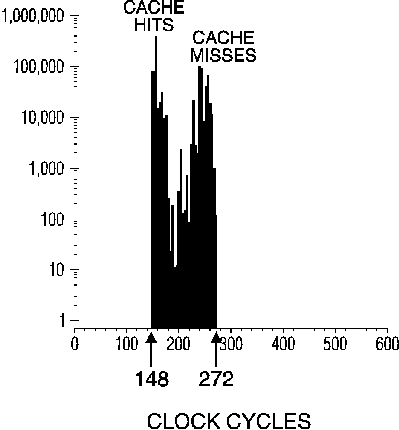
Figure 2. Histogram of one million ISR executions (semi-log scale).
Figure 2 shows the data from Figure 1 on a semi-log scale so that histogram bins with small populations are visible. The clump on the left is where the ISR and the circular queue are largely resident in cache memory, causing mostly cache hits during execution. The clump on the right is where the ISR has been displaced from cache by memory accesses made by the foreground routine. The very worst execution times are instances where not only were there all cache misses during the executed code, but also DRAM refreshes or other untoward events occurred to further slow down the program.
The graph in Figure 2 shows both poor predictability and poor determinacy. The traditional means of predicting performance were far too optimistic in the worst case. Furthermore, the longest execution time is not sharply defined (who is to say that if the program runs a billion times instead of million we won't see a few data points slower than those on the graph?). And, execution time can vary wildly from run to run, depending on what other programs have done to the cache memory between ISR executions.

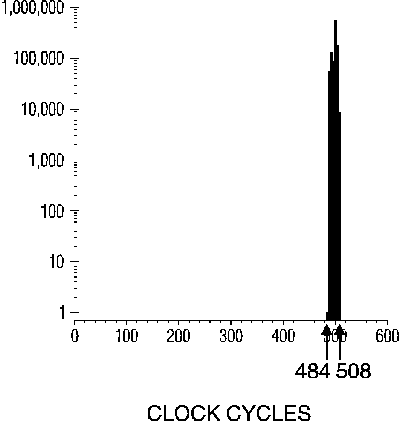
Figure 3. Histogram of one million ISR executions (semi-log scale),
caches turned off.
The simplest solution to taming the performance variations is to simply turn off the caches. Figure 3 shows the same program run with caches turned off. Predictability (using exclusively cache miss timings and accounting for prefetch queue effects) and determinacy might not be too bad for this case, or at least not much worse than the situation in older 80x86 CPUs. Unfortunately, the 80486 is optimized to execute with caches turned on, and needs a cache to keep the instruction execution unit fully fed. Also, turning caches off eliminates "sure-thing" cache hits such as popping registers from the stack after the ISR has pushed them only a few dozen instructions previously. So, timings with caches turned off are much worse than the worst observed case with caches turned on.
Now we have a dilemma. We'd like to improve execution speed by using caches, but we'd also like to limit risk by estimating and bounding delays for worst-case execution. The ideal solution would be to have a software tool that could examine a piece of code and spit out a worst-case timing. Unfortunately, such a tool not only doesn't exist, but the major vendors I have informally surveyed are skeptical of the need or demand (perhaps response to this article can help change that!).
Short of providing real worst-case numbers, there are a few tricks that can help contain the uncertainty associated with using cache memory. The easiest approach is to turn off caches and see if your application still (barely) meets performance requirements. If so, then turning on caches should increase system responsiveness without causing missed deadlines. HOWEVER, be warned that there are a few unlikely but possible situations in which cached accesses to external cache memory can actually run slower than non-cached accesses when copy-back updating is used. So, care should still be exercised to ensure proper performance.
A more sophisticated approach is to leave caches enabled and instrument the performance of critical real-time routines such as ISRs. A high-resolution counter/timer is the tool of choice, combined with automatic data collection to conduct a few million runs. Make sure that data collection takes place on a real-live running system (as opposed to just running the ISR a million times by itself)!
When instrumenting performance, data must be re-taken after every compile and link cycle, because changes in relative memory locations of competing ISRs and loops can have dramatic effects on cache miss ratios. If two common ISRs map into the same place in cache, they can displace each other from cache and almost guarantee all cache misses. On the other hand, with a small change in file linking order or the size of some data array, the two routines can coexist peacefully the very next time the program is compiled.
Instead of just recording the worst case time, plot a histogram of observed times as shown in Figure 2. The shape of the curve can be revealing. If there is only a single hump in your data, you are either getting all cache hits or all cache misses (if they're all cache hits, beware the rare case that could cause misses instead). If there is a tail to the right of the curve rather than a steep drop-off, it may be that there are slower execution times possible that you just haven't seen.
Using a high-resolution timer and taking a large number of samples in real execution conditions is probably the best way to fully understand the performance of your code. It gives the most optimistic possible estimate of execution speed consistent with taking into account tested operating conditions. However, it is also the most time-consuming and difficult approach.
The approach that I recommend as the best tradeoff between avoiding undue pessimism and simpler, faster testing is the cache-flushing approach. In this approach, you measure code timing in a tight loop, but flush (or, in Intel parlance, invalidate) the cache before each loop iteration using the WBINVD instruction. Flushing cache before measurement duplicates the worst case possible execution penalty due to cache misses. However, histogram data must still be accumulated to check for worst case conditions from other sources.
Contrary to what you might think, flushing the cache before executing the code is not at all the same as turning the cache off. That is because multiple accesses to memory locations, such as the stack or data arrays, benefit from cache hits even if the cache has been freshly flushed. Cache flushing as a performance measurement technique tends to make the worst case more common and therefore easier to measure. Cache flushing as an application execution technique can also help to increase determinacy by ensuring that all code executions are equally poor. However, cache flushing won't work miracles, and there can still be significant determinacy problems even when using this technique.
Unfortunately, bounds on worst case performance and cache flushing to increase determinacy aren't sufficient for all applications. In a few cases high determinacy is required along with high predictability and fast speed. In those cases the only alternative may be to use a cache locking strategy. With cache locking, the cache is turned off, then loaded via test registers with data from important locations. In essence, the cache is turned into a small, high-speed block of memory that is under software control. Candidates for cache-locked locations include commonly used variables, interrupt service routines, heavily used subroutines and inner loops. The advantage of cache locking is that complete control over memory access timing (subject to non-cache timing quirks) is possible. The disadvantage is that the programmer must exert considerable effort to wisely choose cached locations; all non-cached locations experience cache misses, and can run very slowly indeed.
The 80486 instruction/data cache is probably the worst source of performance surprises for most users. However, there are other cache-like structures within the CPU that bear watching.
The Translation Lookaside Buffer (TLB) in the 80486 is a special-purpose cache that is used to store the most recently used mappings from virtual to physical address spaces. For most of you, TLB operation is essentially invisible. However, the TLB can only hold translation mappings for 32 memory pages, which totals 128 Kbytes of memory. So, in the likely case that your program and data exceed 128 KBytes, or access more than 32 4K-byte page locations, you may be suffering execution speed variations to process misses for the TLB if it is turned on.

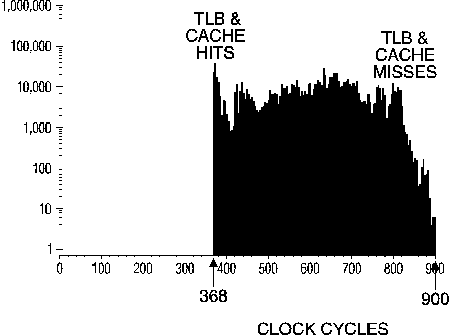
Figure 4. Histogram of one million ISR executions (semi-log scale)
with QEMM installed and caches turned on.
What's that, you say you don't turn on the TLB? Well, if you use some memory managers, such as QEMM or EMM386 to support expanded memory emulation, your TLB is turned on and you are subject to this effect (I found the speed penalty of EMM386 to be significantly higher than using QEMM). Furthermore, memory managers and some operating systems place the CPU in protected mode or virtual-8086 mode, which increases the number of clock cycles required to process interrupts and I/O operations. Figure 4 shows that the example ISR executes approximately three times slower with QEMM memory manager loaded than with no memory manager installed, and shows wider variations in performance. So, if you are hard-pressed for real time performance, consider running without a memory manager and with the TLB turned off. Also, if you are running Windows or some other multitasking operating system, you may encounter similar problems.
There are several other surprise factors that are lurking inside your PC. A fairly obvious one is having your code swapped to disk by your multi-tasking OS. Another is hardware that uses fancy DRAM access modes such as static-column or page mode accesses to speed up performance, especially on older PCs. A third factor is older PC designs that have expansion memories that operate at a different speed than motherboard memory. In all these cases the speed problems are either obvious, or probably minor enough to be lumped in with the other 5% speed fluctuation factors we saw in Figure 3. Nonetheless, if you're trying to squeeze the last ounce of speed variation out of an application, they can become important.
Cache is a very useful mechanism for speeding up average performance in typical PC applications. If you want to reap the benefits of using a standard PC platform for embedded applications, you must beware the real-time pitfalls inherent in cached CPUs. While turning cache (and virtual memory) off is the easy way out, you can probably do better by paying careful attention to the underlying hardware, and performing timing measurements using the cache flushing technique.
Future PC CPUs are likely to be even more prone to performance surprises as more techniques are used to enhance average performance at the expense of predictability and determinacy. While greater average speed is desirable for general-purpose PC applications, embedded system developers will have to keep on top of hardware characteristics to avoid unpleasant experiences.
Hennessy, J. & Patterson, D. (1990) Computer Architecture: a quantitative approach, Morgan Kaufmann Publishers, San Mateo, CA. This is the RISC "bible", and contains a detailed discussion of the memory hierarchy, including caches, in chapter 8.
Intel (1990) i486 Microprocessor Programmer's Reference Manual, Intel, Santa Clara, CA. Chapter 12 describes how to disable & preload the cache. Appendix E contains instruction timing data.
Intel (1990) i486 Microprocessor Hardware Reference Manual, Intel, Santa Clara, CA. Chapter 6 contains a cache tutorial.
Phil Koopman -- koopman@cmu.edu