
Frequently Asked Questions
General questions
1 |
What is a neural trajectory? | |
2 |
If I “get lost” in the space, can I get back to the original projection? | |
3 |
I found a bug. | |
4 |
Why is DataHigh useful for clusters of datapoints (spike counts)? Can’t I just use LDA to find the projection of most separation? | |
5 |
I really need this awesome feature for DataHigh, but it’s not there. What can I do? | |
6 |
What can I do if the neural trajectories look like spaghetti? | |
7 |
I cannot play the DataHigh videos on the website. What's going on? |
Implementation-level questions
1 |
What do the panels actually do? | |
2 |
How do I change an outlying trajectory’s color? | |
3 |
What is % var, and how is it calculated? | |
4 |
How is the average trajectory computed? | |
5 |
How do I restore the default search path for Matlab? | |
6 |
Some of the data is clipped by the projection. How can I zoom out? |
General questions
1. What is a neural trajectory?
|
A: A neural trajectory describes the time-evolution of neural population activity. The basic setup is a high-dimensional space, where each axis represents the firing rate of one neuron in the population. As the neural activity unfolds over time, a trajectory is traced out in the space. For more information, see Yu et al., J Neurophysiol, 2009. |
2. If I “get lost” in the space, can I get back to the original projection?
|
A: If you used the Saved Projections tool, you can easily return to a previous projection by clicking on its thumbnail. Otherwise, if you have saved the desired original projection vectors outside of the DataHigh environment, go to [Toolbox-->Analysis Tools-->Load Proj Vecs] to load the .mat file containing the projection vectors. |
3. I found a bug.
|
A: Please contact us at DataHigh (at) gmail.com. We’ll apply the fly-swatter! |
4. Why is DataHigh useful for clusters of datapoints (spike counts)? Can’t I just use LDA to find the projection of most separation?
|
A: It would be pointless to spend hours with DataHigh looking for a projection that separates the clusters well, when statistical techniques, such as Fisher’s linear discriminant analysis (LDA), does the job quite well. However, LDA only gives one projection...what is happening in the infinite number of other projections? DataHigh can be used to analyze the shape of each cluster and the trial-to-trial variability of the data. See Example 1 for more intuition. |
5. I really need this awesome feature for DataHigh, but it’s not there. What can I do?
|
A: Hack the code! Feel free to manipulate any part of the code as you see fit. However, please adhere to the open source copyright license. If you feel this would be a feature that many would also find useful, shoot us an e-mail, and we would be happy to consider incorporating the feature in the next code release. |
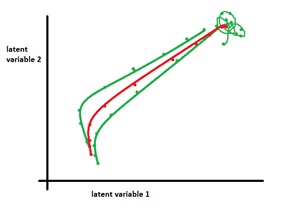
6. What can I do if the neural trajectories look like spaghetti?
|
A: In an arbitrary 2-d projection, the neural trajectories can appear to overlap and look tangled like "spaghetti." The following are steps to take to try to clarify what is being shown in the 2-d projection.
|
Q: I cannot play the DataHigh videos on the website. What's going on?
|
A: We use an open-source javascript video player that allows users to view mp4 videos with HTML5. However, due to technical reasons, some browsers will not properly display videos without particular plug-ins. We found that the videos work with Chrome on Windows and Mac, and with Firefox on Linux. (They seem not to work with IE and Firefox on Windows, nor Chrome on Linux.) For your convenience, we also have included links, directly below the video displays, to download the videos. |
Q: Where can I order my DataHigh t-shirt?
|
A: DataHigh tees will be available for purchase at all major commercial retailers soon, and will come in sizes to fit any dimension. If your t-shirt is one-size-too-large, feel free to return it, and we can reduce the dimensionality for you. |
Implementation-level questions
1. What do the panels actually do?
|
A: Each panel shows a preview of what would happen if you fixed one projection vector and rotated the other vector in an orthogonal direction by 180 degrees. By holding on a panel, you are slowly incrementing the angle of the plane of rotation, which continuously updates the main projection. |
2: How do I change an outlying trajectory’s color?
|
A: Go to [Toolbox-->Update Colors-->Update Trial] and change the appropriate epochColors field, or change it in the data struct passed into DataHigh. |
3: What is % var, and how is it calculated?
|
A: % var displays how much variance is in the current projection, compared to the high-d latent data. Mathematically, we take the trace of the current projection’s covariance matrix and divide it by the trace of the covariance matrix of the latent data. The highest possible % var is achieved when the projection vectors are the first two principal components. |
4: How is the average trajectory computed?
|
A: For visual purposes, we would like to have a reference trajectory that represents an average of the single-trial neural trajectories for different conditions. Note that this is different from, but qualitatively similar to, averaging before dimensionality reduction to produce trial-averaged neural trajectories. We would like this average trajectory to obey epoch boundaries (i.e., at each epoch boundary, we should take an average) and be continuous. We opted for a method that linearly resamples each neural trajectory based on the distance traveled by the trajectory. Thus, for an epoch, if two trajectories travel roughly the same distance but have different time durations, the average only considers the distances.
|
5: How do I restore the default search path for Matlab?
|
A: You can reset the path by typing in restoredefaultpath into the Matlab command line. When you first run DataHigh, it automatically adds the /DataHigh/ folder and necessary sub-folders to the path. You can call DataHigh outside of the DataHigh folder. For example, you can format the data in a project folder, and simply call DataHigh (making sure DataHigh has already been added to the path), without the hassle of changing directories. When you close out of Matlab, the path is automatically reset to default. |
6: Some of the data is clipped by the projection. How can I zoom out?
|
A: Automatically re-scaling the axes can lead to mis-interpretation of the data and to losing a visualizer's "bearing" of the high-dimensional latent space. Thus, DataHigh does not automatically re-scale the projection axes. However, the user can re-scale the axes to zoom in or zoom out of the projection by clicking [Analysis Tools --> Zoom/Rotate], and sliding the leftmost scrollbar (labeled "Zoom") to a desired scaling. DataHigh maintains this scaling throughout the analysis tools. |