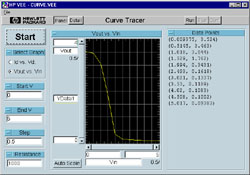
Panel allows selection of characteristic plots and testing voltages defined by real inputs Start Voltage, Stop voltage, and Step voltage. Graph is autoscaling with the even of each input coordinates. Coordinates plotted are logged in to the text box.
The "Start" button or "Run" will begin voltage sweep for circuit testing, where "Stop" will halt the sweep, but hold the coordinates already tested.
Details
data input & readings
The user will decide the input voltages, in which the value divided by 2 are sent to the function generator. This results in a correct applied voltage to the circuit. These values are comfirmed by the oscilloscope, which is probing the input voltage. The
second probe is monitoring the VOUT point, which is read by the component driver of the Multimeter.
plot selection
The user has the option between VOUT vs. VIN or ID vs. VD. Before hitting start the desired graph is chosen. Switching the selection will not affect the plot. The selection at the beginning of the testing will r
emain.
The selection on the characteristic plot box decides which values are sent to the logging alphanumeric text box and the X vs. Y plot.
data collection
During the circuit testing, four variables are created:
- VOUT: Direct reading from the multimeter
- VIN: Direct reading from the oscilloscope
- ID: Calulated by VOUT divided by R.
- VD: Calculated by VOUT minus VIN.
These four variables are then built into a record each time a new data set is received from the meters. Four Containers holding the data of each field in the record are created.
data display
The routing of the appropriate display of data is controlled by a junction box, which makes a decision of which data to sent to the logging alphanumeric text box and the X vs. Y plot. The junction is dependent upon the selection of the characteristic plot
list box.
Improvements
Several improvements to the curve tracer can be fixed. The instrument panel would be more functional and efficient if it allowed the user to toggle between the two characteristic plots.
The ability to switch circuit elements would add yet more functionality. With current resources, this becomes very tricky and cumbersome using the Lighthouse for Windows to switch in and out elements. Should the HP 34970A Data Acquisition/Switch Unit be a
cquired, this task may become very easy, quickly adding flexibility to the Curve Tracer and the Remote Lab as a whole.