
Objectives
Characterize an unknown circuit from terminal measurements
Gain experience with remote access
Introduction
A weather telemetry station is located in a remote location near the top of a mountain peak in the Rockies. Access is limited; much of the route is passable only with a 4-wheel drive vehicle, and the last half-mile can only be traveled by foot. The data from this station has been shown to be particularly valuable for predicting serious storms in populated areas about 50 miles to the west, so the weather service has made the operation of the station a high priority. It is costly and time-consuming to visit the station for service and maintenance, so the station is controlled and monitored remotely. However, a malfunction has recently been detected so plans are underway to send a team to repair the station. Because access is so difficult, it is important to pin-point the problem before-hand so that the repair team will be sure to have the necessary parts and equipment with them to perform the needed repair.
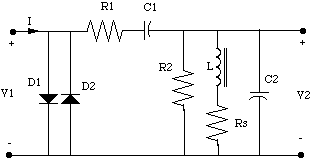
From preliminary measurements, it has been determined that the failure is in a telemetry input filter circuit. The circuit diagram of the filter is shown below:

The component values are as follows:
· D1,D2: 1N4001 silicon diodes
· C1=C2=0.33 uF
· R1= R2=1K
· Rs= 3.7 [[Omega]] (series resistance of actual inductor; not physically a separate component)
· L= 1 mH
The purpose of the diodes is to protect other components in the system from voltage transients and static discharges. As long as the input voltage V1 is less than Von, the diodes are off. When V1 exceeds Von with either positive or negative polarity, one of the diodes turns on and clamps the input voltage at Von. When the diodes are off, the circuit functions as a narrowband filter, so that |V2/V1| is maximum at the resonant frequency.
The specifications for the circuit are:
· Clamping voltage: +/-0.6 V +/-0.5 V
· Filter center frequency: 8.85 KHz +/- 20%
· Filter bandwidth (full bandwidth at which |V2/V1| is down by 3 dB from the peak transmission): 1550 Hz +/- 20%
· Insertion loss at filter center frequency: -10 dB +/- 2dB
Procedure
Part 1: Measurement Configuration
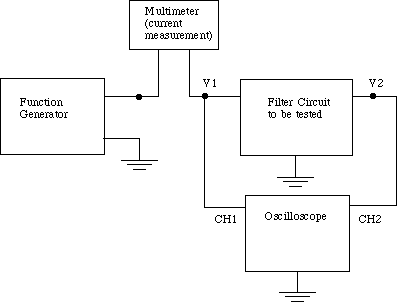
Of course, from a remote location it is not possible to measure everything that you might if you were there in person. Consequently you must work with the measurements that are accessible. The measurement configuration that is available remotely is shown in the figure below.

Part 2: Assignment
1. Design and construct a virtual instrument for testing the filter circuit as connected above. The virtual instrument should execute a sequence of steps to evaluate each of the specifications mentioned earlier. The program should be able to generate plots of I vs. V1 for DC inputs, and |V2/V1| vs. frequency for small-signal AC inputs. The program should have an easy-to-use interface panel, and should generate a report file with the following format:
FILTER TEST
===========================
day/mon/year time AM/PM
Parameter Value Nominal LowLim HiLim Result
+Vclamp (V) 0.65 0.6 0.48 0.72 PASS
-Vclamp (V) -0.70 -0.6 -0.72 -0.48 PASS
Res. Freq.(Hz) 8.85k 7.05k 8k 12k PASS
Bandwidth (Hz) 1600 1550 1240 1860 PASS
Ins. Loss (dB) -10.9 -10 -12 -8 PASS
2. Use the results of these measurements to determine which component(s) in your circuit are defective. Write a short report (one or two pages) containing the results of your tests and the analysis leading to your conclusions about which component(s) are defective.
Lab Logistics
Since you may find it helpful to consult some of the instrument reference manuals, you may design and program your virtual instrument either in the lab or remotely. However, the actual testing and diagnosis must be performed remotely. Parts will be distributed to enable you to breadboard the filter circuit to assist in program development. The six stations in the lab will be configured and equipped with filter circuits between 5:00pm Friday and Noon the following Monday on the following weekends: Nov. 3-9, Nov. 10-13. All of the filter circuits will have a malfunction owing to a component that has failed or is out of spec, but not all of the circuits will have the same malfunction. You may choose to analyze the filter at any one of the stations. Labs will be due Wednesday, Nov. 15.
You should be able to:
· Demonstrate your test program with the circuit above assembled on a protoboard. The program should generate:
· I-V1 curve for DC applied to the filter input
· Graph of |V2/V1| vs. frequency for small AC inputs
· Output report file in a format similar to the above example
· Present a report containing your analysis of one of the "black box" filters, what component(s) you believe to be faulty, and how you arrived at that conclusion (1-2 pages). Be sure to identify the filter tested by the name of the computer controlling the equipment.